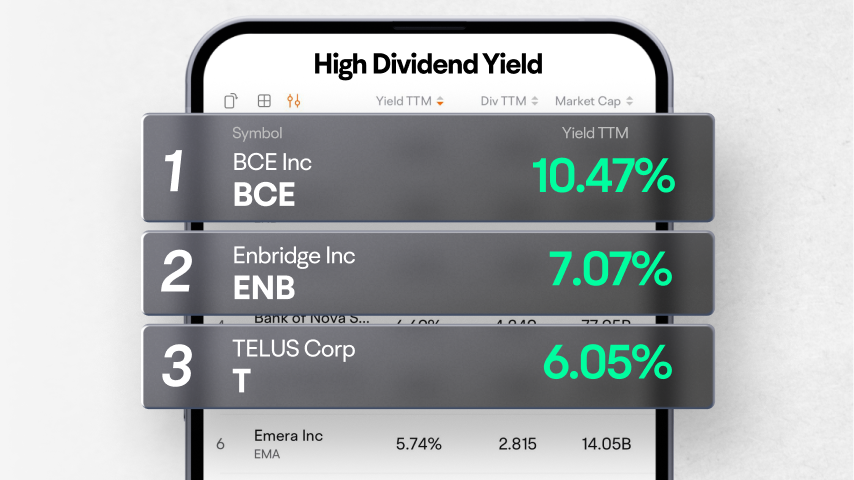
Enbridge Inc
ENB
Power Corporation of Canada
POW
Bank of Nova Scotia
BNS
Emera Inc
EMA
BCE Inc
BCE


| (Q2)Sep 30, 2024 | (Q1)Jun 30, 2024 | (FY)Mar 31, 2024 | (Q4)Mar 31, 2024 | (Q3)Dec 31, 2023 | (Q2)Sep 30, 2023 | (Q1)Jun 30, 2023 | (FY)Mar 31, 2023 | (Q4)Mar 31, 2023 | (Q3)Dec 31, 2022 | |
|---|---|---|---|---|---|---|---|---|---|---|
| Assets | ||||||||||
| Current assets | ||||||||||
| Cash, cash equivalents and short term investments | -37.31%1.15M | 251.37%7.19M | -34.99%9.77M | -34.99%9.77M | -92.94%6.41M | -98.00%1.84M | -97.68%2.05M | -82.67%15.02M | -82.67%15.02M | 4.61%90.84M |
| -Cash and cash equivalents | -37.31%1.15M | 251.37%7.19M | -34.99%9.77M | -34.99%9.77M | -92.94%6.41M | -98.00%1.84M | -97.68%2.05M | -82.67%15.02M | -82.67%15.02M | 4.61%90.84M |
| Receivables | 7.08%133.68M | 9.47%128.44M | 19.34%163.49M | 19.34%163.49M | 28.45%136.61M | 21.03%124.84M | 26.49%117.33M | 16.26%137M | 16.26%137M | 17.52%106.35M |
| -Accounts receivable | 8.01%132.3M | 10.78%127.28M | 21.91%146.79M | 21.91%146.79M | 30.28%135.02M | 21.12%122.49M | 26.39%114.9M | 14.25%120.41M | 14.25%120.41M | 19.50%103.64M |
| -Taxes receivable | -41.12%1.38M | -52.34%1.16M | 0.69%16.7M | 0.69%16.7M | -41.25%1.59M | 16.48%2.35M | 31.43%2.43M | 66.10%16.59M | 66.10%16.59M | -27.98%2.71M |
| Inventory | 22.88%372.29M | 20.54%345.83M | 22.95%323.35M | 22.95%323.35M | 26.77%313.12M | 31.34%302.97M | 31.99%286.91M | 31.27%263M | 31.27%263M | 16.23%247M |
| Prepaid assets | ---- | ---- | 3.74%6.14M | 3.74%6.14M | ---- | ---- | ---- | 50.52%5.92M | 50.52%5.92M | ---- |
| Hedging assets-current | 920.52%11.89M | 114.28%5.97M | 619.69%2.78M | 619.69%2.78M | 931.94%3.2M | --1.17M | 31.71%2.79M | -92.98%386K | -92.98%386K | -94.42%310K |
| Other current assets | 12.48%25.49M | 16.42%27.28M | 23.21%2.33M | 23.21%2.33M | 23.86%22.41M | 13.15%22.67M | 41.00%23.43M | 64.52%1.89M | 64.52%1.89M | 11.39%18.1M |
| Total current assets | 20.07%544.5M | 19.01%514.71M | 20.00%507.85M | 20.00%507.85M | 4.14%481.75M | 1.78%453.47M | 3.67%432.5M | 1.87%423.2M | 1.87%423.2M | 12.38%462.59M |
| Non current assets | ||||||||||
| Net PPE | -0.95%199.07M | -0.56%200.33M | -2.43%200.51M | -2.43%200.51M | -2.89%199.06M | -2.60%200.97M | -2.58%201.45M | -1.60%205.49M | -1.60%205.49M | -4.78%204.99M |
| -Gross PPE | ---- | ---- | 4.80%500.31M | 4.80%500.31M | ---- | ---- | ---- | 6.63%477.38M | 6.63%477.38M | ---- |
| -Accumulated depreciation | ---- | ---- | -10.27%-299.8M | -10.27%-299.8M | ---- | ---- | ---- | -13.82%-271.89M | -13.82%-271.89M | ---- |
| Financial assets | 6,696.72%4.15M | -21.68%1.53M | 293.16%1.84M | 293.16%1.84M | 772.85%4.37M | 74.29%61K | 11.33%1.96M | -96.73%468K | -96.73%468K | -93.93%501K |
| Non current accounts receivable | ---- | ---- | -7.69%11.19M | -7.69%11.19M | ---- | ---- | ---- | 93.20%12.13M | 93.20%12.13M | ---- |
| Goodwill and other intangible assets | 11.21%184.7M | 5.65%176.83M | 4.92%174.21M | 4.92%174.21M | 6.23%170.2M | 9.10%166.08M | 10.53%167.38M | 6.76%166.04M | 6.76%166.04M | -0.04%160.22M |
| -Goodwill | 6.40%117.9M | 2.47%114.56M | 1.13%113.65M | 1.13%113.65M | 1.57%112.2M | 6.33%110.81M | 6.17%111.8M | 3.87%112.38M | 3.87%112.38M | -1.42%110.47M |
| -Other intangible assets | 20.85%66.79M | 12.04%62.27M | 12.87%60.56M | 12.87%60.56M | 16.56%58M | 15.12%55.27M | 20.47%55.58M | 13.39%53.65M | 13.39%53.65M | 3.15%49.76M |
| Defined pension benefit | ---- | ---- | 16.74%5.5M | 16.74%5.5M | ---- | ---- | ---- | -26.31%4.71M | -26.31%4.71M | ---- |
| Non current deferred assets | 6.94%8.23M | 53.78%9.51M | 11.06%10.34M | 11.06%10.34M | -28.24%7.86M | -7.64%7.69M | -33.85%6.18M | 41.96%9.31M | 41.96%9.31M | 81.32%10.95M |
| Other non current assets | 45.66%19.05M | 70.67%17.68M | ---- | ---- | -8.35%11.37M | 15.78%13.08M | -16.20%10.36M | ---- | ---- | 222.30%12.4M |
| Total non current assets | 7.04%415.18M | 4.79%405.87M | 1.37%403.58M | 1.37%403.58M | 0.98%392.86M | 2.55%387.88M | 1.48%387.33M | 0.06%398.14M | 0.06%398.14M | -1.18%389.06M |
| Total assets | 14.06%959.69M | 12.29%920.58M | 10.97%911.42M | 10.97%911.42M | 2.70%874.6M | 2.13%841.35M | 2.63%819.83M | 0.98%821.34M | 0.98%821.34M | 5.75%851.65M |
| Liabilities | ||||||||||
| Current liabilities | ||||||||||
| Current debt and capital lease obligation | 18.53%17.51M | 40.51%17.66M | 42.35%16.26M | 42.35%16.26M | 20.05%14.61M | 18.34%14.77M | 22.81%12.57M | 5.45%11.43M | 5.45%11.43M | -14.14%12.17M |
| -Current debt | 18.53%17.51M | 40.51%17.66M | 42.35%16.26M | 42.35%16.26M | 20.05%14.61M | 18.34%14.77M | 22.81%12.57M | 5.45%11.43M | 5.45%11.43M | -14.14%12.17M |
| Payables | 32.91%160.45M | 19.90%142.88M | -0.11%93.22M | -0.11%93.22M | 11.82%125.48M | 7.20%120.72M | 14.10%119.16M | 22.98%93.33M | 22.98%93.33M | 9.75%112.22M |
| -accounts payable | 30.82%157.04M | 18.38%140.97M | -2.77%87.04M | -2.77%87.04M | 12.21%125.4M | 8.07%120.04M | 15.57%119.09M | 24.96%89.52M | 24.96%89.52M | 10.18%111.76M |
| -Total tax payable | 402.50%3.41M | 2,372.73%1.9M | 366.52%2.17M | 366.52%2.17M | -82.03%83K | -55.68%679K | -94.50%77K | -43.58%466K | -43.58%466K | -44.00%462K |
| -Other payable | ---- | ---- | 19.86%4.01M | 19.86%4.01M | ---- | ---- | ---- | -2.51%3.34M | -2.51%3.34M | ---- |
| Current accrued expenses | ---- | ---- | 35.42%51.67M | 35.42%51.67M | ---- | ---- | ---- | -3.26%38.16M | -3.26%38.16M | ---- |
| Current provisions | -18.49%13.41M | -23.43%12.51M | -26.86%12.17M | -26.86%12.17M | -4.50%16.33M | -13.34%16.45M | -20.18%16.33M | -24.14%16.63M | -24.14%16.63M | -13.46%17.1M |
| Current deferred liabilities | 12.43%61M | 4.10%63.14M | 9.46%64.48M | 9.46%64.48M | 9.08%61.37M | 19.08%54.26M | 73.32%60.65M | 97.17%58.9M | 97.17%58.9M | 49.82%56.26M |
| Other current liabilities | -39.89%2.7M | 25.45%4.01M | -42.71%3.15M | -42.71%3.15M | -68.00%2.26M | -65.79%4.49M | 2.14%3.19M | 196.60%5.49M | 196.60%5.49M | 468.62%7.07M |
| Current liabilities | 21.06%255.07M | 13.34%240.18M | 7.59%240.95M | 7.59%240.95M | 7.44%220.06M | 3.91%210.69M | 22.31%211.91M | 24.53%223.94M | 24.53%223.94M | 17.05%204.82M |
| Non current liabilities | ||||||||||
| Long term debt and capital lease obligation | -38.79%122.06M | 13.03%197.82M | 21.19%201.76M | 21.19%201.76M | -9.27%207.96M | -13.81%199.41M | -22.46%175.01M | -26.23%166.48M | -26.23%166.48M | 0.18%229.2M |
| -Long term debt | -38.79%122.06M | 13.03%197.82M | 21.19%201.76M | 21.19%201.76M | -9.27%207.96M | -13.81%199.41M | -22.46%175.01M | -26.23%166.48M | -26.23%166.48M | 0.18%229.2M |
| Derivative product liabilities | -66.28%1.64M | -19.06%2.59M | -45.01%2.69M | -45.01%2.69M | -58.39%2.39M | -53.58%4.87M | 10.42%3.2M | 489.76%4.9M | 489.76%4.9M | 192.30%5.73M |
| Long term provisions | -11.22%13.01M | -4.78%14.13M | -8.72%14.22M | -8.72%14.22M | -5.29%14.67M | -2.36%14.66M | -0.52%14.84M | 5.04%15.58M | 5.04%15.58M | -5.62%15.49M |
| Employee benefits | ---- | ---- | -40.61%566K | -40.61%566K | ---- | ---- | ---- | -10.35%953K | -10.35%953K | ---- |
| Non current deferred liabilities | -2.17%12.82M | 15.78%13.77M | 23.47%20.98M | 23.47%20.98M | 52.70%15.15M | 297.30%13.1M | 43.37%11.9M | 34.14%16.99M | 34.14%16.99M | 26.60%9.92M |
| Other non current liabilities | 1,404.17%85.87M | -18.86%7.71M | -60.90%617K | -60.90%617K | 26.28%6.73M | 19.06%5.71M | 52.50%9.5M | 34.41%1.58M | 34.41%1.58M | 39.01%5.33M |
| Total non current liabilities | -0.99%235.4M | 10.06%236.02M | 16.64%240.84M | 16.64%240.84M | -7.07%246.89M | -10.27%237.74M | -16.89%214.45M | -19.42%206.48M | -19.42%206.48M | 2.64%265.67M |
| Total liabilities | 9.37%490.47M | 11.69%476.21M | 11.93%481.79M | 11.93%481.79M | -0.75%466.95M | -4.12%448.44M | -1.15%426.36M | -1.30%430.42M | -1.30%430.42M | 8.45%470.49M |
| Shareholders'equity | ||||||||||
| Share capital | -0.26%81.62M | -0.72%81.62M | -1.33%81.36M | -1.33%81.36M | -1.80%81.36M | -1.58%81.83M | -1.38%82.21M | 0.33%82.46M | 0.33%82.46M | 0.15%82.85M |
| -common stock | -0.26%81.62M | -0.72%81.62M | -1.33%81.36M | -1.33%81.36M | -1.80%81.36M | -1.58%81.83M | -1.38%82.21M | 0.33%82.46M | 0.33%82.46M | 0.15%82.85M |
| Additional paid-in capital | 17.51%8.75M | 19.40%8.46M | 21.46%8.19M | 21.46%8.19M | 21.95%7.82M | 22.36%7.45M | 23.37%7.09M | 16.85%6.74M | 16.85%6.74M | 16.78%6.41M |
| Retained earnings | 16.48%346.45M | 14.56%335.14M | 11.53%323.05M | 11.53%323.05M | 5.65%302.46M | 4.38%297.43M | 3.75%292.56M | 2.54%289.65M | 2.54%289.65M | 5.22%286.28M |
| Gains losses not affecting retained earnings | 422.01%32.4M | 64.90%19.15M | 41.19%17.04M | 41.19%17.04M | 185.32%16.02M | 134.25%6.21M | 429.11%11.61M | 75.85%12.07M | 75.85%12.07M | -50.04%5.61M |
| Total stockholders'equity | 19.42%469.22M | 12.94%444.37M | 9.90%429.64M | 9.90%429.64M | 6.95%407.66M | 10.35%392.91M | 7.05%393.47M | 3.61%390.92M | 3.61%390.92M | 2.59%381.16M |
| Noncontrolling interests | ---- | ---- | ---- | ---- | ---- | ---- | ---- | ---- | ---- | --0 |
| Total equity | 19.42%469.22M | 12.94%444.37M | 9.90%429.64M | 9.90%429.64M | 6.95%407.66M | 10.35%392.91M | 7.05%393.47M | 3.61%390.92M | 3.61%390.92M | 2.59%381.16M |
| Accounting Standards | US-GAAP | US-GAAP | US-GAAP | US-GAAP | US-GAAP | US-GAAP | US-GAAP | US-GAAP | US-GAAP | US-GAAP |
| Audit Opinions | -- | -- | Unqualified Opinion | -- | -- | -- | -- | Unqualified Opinion | -- | -- |
FY: Financial Year. Refers to the 10-K file disclosed by the listed company to the SEC.
Q: Quarter. Refers to the 10-Q file disclosed by the listed company to the SEC. Q1, Q2, Q3, and Q4 are quarterly reports each with a span of 3 months; Q6 and Q9 are cumulative reports, with Q6 including 6 months and Q9 9 months.