TC Energy Corp
TRP
Bank of Nova Scotia
BNS
The Toronto-Dominion Bank
TD
Power Corporation of Canada
POW
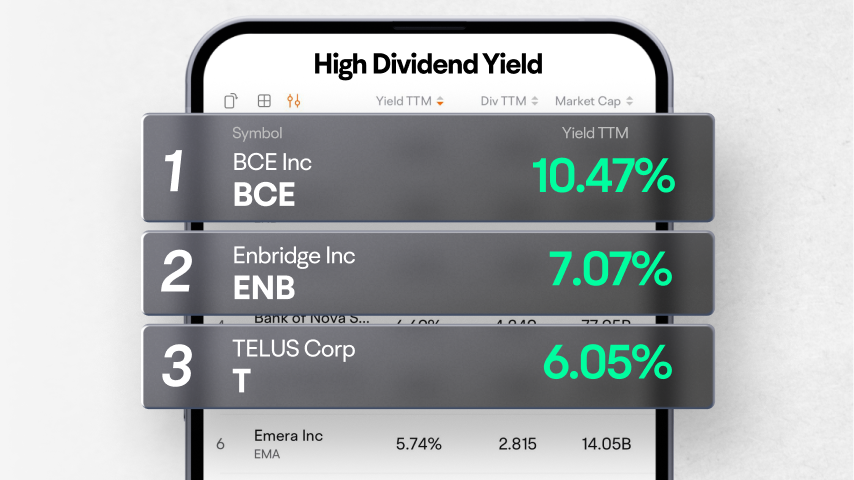
TELUS Corp
T


| (Q3)Sep 30, 2024 | (Q2)Jun 30, 2024 | (Q1)Mar 31, 2024 | (FY)Dec 31, 2023 | (Q4)Dec 31, 2023 | (Q3)Sep 30, 2023 | (Q2)Jun 30, 2023 | (Q1)Mar 31, 2023 | (FY)Dec 31, 2022 | (Q4)Dec 31, 2022 | |
|---|---|---|---|---|---|---|---|---|---|---|
| Total revenue | 44.38%14.31M | 15.49%13.19M | -23.53%11.48M | 17.22%50.51M | 3.42%14.17M | -3.18%9.91M | 11.35%11.42M | 68.66%15.02M | 25.97%43.09M | 52.22%13.7M |
| Net interest income | -2.89%13.18M | -1.78%13.11M | -14.57%12.78M | 23.52%55.23M | 1.24%13.34M | 8.63%13.57M | 31.39%13.35M | 68.50%14.96M | 23.81%44.72M | 34.77%13.18M |
| -Net interest income | -2.32%16.75M | -3.28%16.88M | -14.47%16.22M | 18.95%70.94M | 2.05%17.38M | 5.56%17.15M | 26.44%17.46M | 50.92%18.96M | 26.33%59.64M | 30.80%17.03M |
| -Total interest expense | -0.14%3.57M | -8.17%3.77M | -14.13%3.44M | 5.26%15.71M | 4.79%4.03M | -4.68%3.57M | 12.65%4.1M | 8.56%4M | 34.53%14.92M | 18.84%3.85M |
| -Including:Interest expense for long term debt and capital securities | -15.63%2.53M | -11.14%2.66M | -11.05%2.66M | -7.59%12.12M | -4.36%3.14M | -3.87%3M | -8.48%2.99M | -13.22%2.99M | 34.45%13.12M | 13.55%3.29M |
| -Including:Other interest expense | 80.62%1.04M | -0.17%1.11M | -23.20%779.52K | 98.57%3.59M | 58.53%887.78K | -8.68%575.05K | 197.88%1.11M | 314.99%1.01M | 35.06%1.81M | 63.57%560K |
| Non interest income | 130.86%1.13M | 104.05%78.11K | -2,609.08%-1.3M | -190.84%-4.72M | 58.88%822.06K | -62.23%-3.66M | -2,125.89%-1.93M | 132.96%51.89K | 14.92%-1.62M | 166.22%517.41K |
| -Other non interest income | 2,265.64%2.33M | 167.68%187.91K | 28.71%66.79K | 101.44%962.94K | 220.80%742.36K | -23.70%98.49K | -26.30%70.2K | 132.96%51.89K | -31.08%478.02K | 708.12%231.41K |
| -Gain loss on sale of assets | 68.09%-1.2M | 94.51%-109.8K | ---1.37M | -170.49%-5.68M | -72.13%79.7K | -57.59%-3.76M | ---2M | --0 | 19.23%-2.1M | 135.31%286K |
| Credit losses provision | -1,974.76%-3.79M | -140.70%-3.12M | 68.42%-1.41M | -227.98%-9.7M | -13.92%-4.14M | -74.84%202.34K | -153.15%-1.3M | -1,254.41%-4.46M | -357.23%-2.96M | -1,032.20%-3.64M |
| Non interest expense | 2.45%1.56M | -4.26%1.53M | -18.29%1.5M | -15.89%6.65M | -19.88%1.69M | -46.93%1.52M | 6.31%1.6M | 28.77%1.84M | 47.00%7.9M | 27.26%2.1M |
| Selling and administrative expenses | -16.55%371.76K | -12.79%418.91K | 11.51%382.31K | -44.03%1.8M | -44.53%528.92K | -73.08%445.46K | 44.03%480.33K | 27.13%342.86K | 162.32%3.21M | 114.70%953.46K |
| -General and administrative expense | -16.55%371.76K | -12.79%418.91K | 11.51%382.31K | -44.03%1.8M | -44.53%528.92K | -73.08%445.46K | 44.03%480.33K | 27.13%342.86K | 162.32%3.21M | 114.70%953.46K |
| Other non-interest expense | 10.33%1.18M | -0.61%1.11M | -25.12%1.12M | 3.38%4.85M | 0.53%1.16M | -11.07%1.07M | -4.41%1.12M | 29.16%1.5M | 12.99%4.69M | -4.83%1.15M |
| Income from associates and other participating interests | ||||||||||
| Special income (charges) | ||||||||||
| Other non-operating income (expenses) | ||||||||||
| Income before tax | 4.26%8.96M | 0.14%8.53M | -1.63%8.57M | 5.99%34.16M | 4.78%8.34M | 5.07%8.59M | 3.45%8.52M | 10.82%8.71M | 7.50%32.23M | 2.85%7.96M |
| Income tax | ||||||||||
| Earnings from equity interest net of tax | ||||||||||
| Net income | 4.26%8.96M | 0.14%8.53M | -1.63%8.57M | 5.99%34.16M | 4.78%8.34M | 5.07%8.59M | 3.45%8.52M | 10.82%8.71M | 7.50%32.23M | 2.85%7.96M |
| Net Income continuous operations | 4.26%8.96M | 0.14%8.53M | -1.63%8.57M | 5.99%34.16M | 4.78%8.34M | 5.07%8.59M | 3.45%8.52M | 10.82%8.71M | 7.50%32.23M | 2.85%7.96M |
| Noncontrolling interests | ||||||||||
| Net income attributable to the company | 4.26%8.96M | 0.13%8.53M | -1.63%8.57M | 5.99%34.16M | 4.78%8.34M | 5.07%8.59M | 3.45%8.52M | 10.82%8.71M | 7.50%32.23M | 2.85%7.96M |
| Preferred stock dividends | ||||||||||
| Other under preferred stock dividend | ||||||||||
| Net income attributable to common stockholders | 4.26%8.96M | 0.13%8.53M | -1.63%8.57M | 5.99%34.16M | 4.78%8.34M | 5.07%8.59M | 3.45%8.52M | 10.82%8.71M | 7.50%32.23M | 2.85%7.96M |
| Diluted earnings per share | 0.40%0.25 | 0.82%0.247 | -1.98%0.248 | 5.54%0.991 | 4.76%0.242 | 5.06%0.249 | 2.51%0.245 | 9.05%0.253 | -1.16%0.939 | -1.28%0.231 |
| Basic earnings per share | 0.81%0.249 | 1.65%0.247 | 2.07%0.247 | 5.69%0.984 | 4.76%0.242 | 5.56%0.247 | 2.53%0.243 | 5.22%0.242 | -1.17%0.931 | -1.28%0.231 |
| Dividend per share | 0.00%0.234 | 0.00%0.234 | 0.00%0.234 | 0.00%0.936 | 0.00%0.234 | 0.00%0.234 | 0.00%0.234 | 0.00%0.234 | 0.00%0.936 | 0.00%0.234 |
| Accounting Standards | US-GAAP | US-GAAP | US-GAAP | US-GAAP | US-GAAP | US-GAAP | US-GAAP | US-GAAP | US-GAAP | US-GAAP |
FY: Financial Year. Refers to the 10-K file disclosed by the listed company to the SEC.
Q: Quarter. Refers to the 10-Q file disclosed by the listed company to the SEC. Q1, Q2, Q3, and Q4 are quarterly reports each with a span of 3 months; Q6 and Q9 are cumulative reports, with Q6 including 6 months and Q9 9 months.