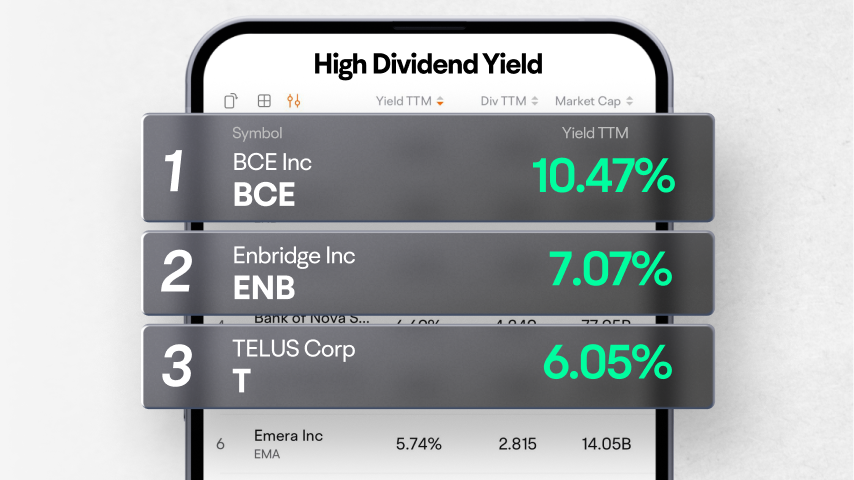
BCE Inc
BCE
TC Energy Corp
TRP
TELUS Corp
T
Enbridge Inc
ENB
The Toronto-Dominion Bank
TD


| (Q2)Sep 30, 2024 | (Q1)Jun 30, 2024 | (FY)Mar 31, 2024 | (Q4)Mar 31, 2024 | (Q3)Dec 31, 2023 | (Q2)Sep 30, 2023 | (Q1)Jun 30, 2023 | (FY)Mar 31, 2023 | (Q4)Mar 31, 2023 | (Q3)Dec 31, 2022 | |
|---|---|---|---|---|---|---|---|---|---|---|
| Total revenue | 33.26%14.69M | 69.07%26.51M | -22.71%65.57M | -3.76%20.4M | 2.85%18.47M | -48.90%11.03M | -79.88%15.68M | -76.34%84.84M | -82.81%21.2M | -73.83%17.96M |
| Operating revenue | 33.26%14.69M | 69.07%26.51M | -22.71%65.57M | -3.76%20.4M | 2.85%18.47M | -48.90%11.03M | -79.88%15.68M | -75.78%84.84M | -82.26%21.2M | -73.22%17.96M |
| Cost of revenue | 12.43%8.41M | 58.54%17.88M | -33.14%43.55M | -18.70%13.57M | -14.54%11.67M | -53.81%7.48M | -84.21%11.28M | -80.71%65.12M | -85.62%16.69M | -78.87%13.65M |
| Gross profit | 77.27%6.28M | 96.04%8.63M | 11.71%22.03M | 51.65%6.83M | 57.94%6.8M | -34.07%3.54M | -32.33%4.4M | -6.31%19.72M | -37.56%4.5M | 7.13%4.31M |
| Operating expense | 17.59%1.89M | 34.06%3.19M | -4.65%7.31M | 11.99%1.83M | 0.01%1.49M | -13.90%1.61M | -15.08%2.38M | -52.46%7.67M | -17.53%1.63M | 5.37%1.49M |
| Selling and administrative expenses | 18.77%1.48M | 40.32%2.82M | 1.10%5.84M | 16.49%1.41M | 1.61%1.17M | -18.36%1.25M | -0.24%2.01M | -60.01%5.77M | -41.22%1.21M | -57.38%1.15M |
| -General and administrative expense | 18.77%1.48M | 40.32%2.82M | 1.10%5.84M | 16.49%1.41M | 1.61%1.17M | -18.36%1.25M | -0.24%2.01M | -50.73%5.77M | -15.82%1.21M | -44.24%1.15M |
| Research and development costs | 33.48%219.57K | 3.64%179.51K | -3.99%679.31K | 1.26%217.78K | -8.53%123.81K | 11.93%164.5K | -17.58%173.21K | 6.57%707.54K | 0.56%215.07K | 26.88%135.35K |
| Depreciation amortization depletion | -3.06%191.64K | -2.99%191.54K | -33.10%791.75K | -3.30%198.23K | -3.31%198.39K | 1.60%197.69K | -65.88%197.44K | 15.66%1.18M | -15.63%204.99K | -22.78%205.18K |
| -Depreciation and amortization | -3.06%191.64K | -2.99%191.54K | -33.10%791.75K | -3.30%198.23K | -3.31%198.39K | 1.60%197.69K | -65.88%197.44K | 15.66%1.18M | -15.63%204.99K | -22.78%205.18K |
| Operating profit | 127.06%4.38M | 169.12%5.44M | 22.11%14.72M | 74.16%5M | 88.58%5.31M | -44.85%1.93M | -45.41%2.02M | 144.83%12.05M | -45.12%2.87M | 8.08%2.82M |
| Net non-operating interest income (expenses) | -111.32%-76.61K | -104.13%-32.64K | -13.28%1.55M | -139.35%-276.59K | -34.78%360.83K | 83.43%676.46K | 382.83%790.33K | 389.62%1.79M | 606.03%702.83K | 610.82%553.21K |
| Non-operating interest income | -17.75%556.4K | -7.27%732.91K | 47.81%2.64M | -23.37%538.6K | 15.36%638.19K | 83.43%676.46K | 382.83%790.33K | 361.21%1.79M | 609.04%702.83K | 550.02%553.21K |
| Non-operating interest expense | --633K | --765.54K | --1.09M | --815.19K | --277.36K | --0 | --0 | --0 | --0 | --0 |
| Other net income (expenses) | -1,052.61%-7.73M | 114.76%120.42K | -373.32%-37.85M | -399.73%-36.12M | -97.00%209.38K | -2,057.18%-670.65K | 90.04%-815.69K | 26.70%-8M | 36.36%-7.23M | 4,303.91%6.97M |
| Gain on sale of security | 4.02%-115.57K | 172.51%248.64K | -445.07%-13.7M | -10,376.08%-12.92M | 59.69%-313.72K | -127.77%-120.41K | 85.06%-342.88K | -304.82%-2.51M | -79.42%125.76K | -418.58%-778.16K |
| Special income (charges) | ---- | ---- | -94.29%-10.17M | ---- | ---- | ---- | ---- | 55.95%-5.23M | ---- | ---- |
| -Less:Impairment of capital assets | ---- | ---- | 94.24%10.16M | ---- | ---- | ---- | ---- | -55.95%5.23M | ---- | ---- |
| -Gain on sale of property,plant,equipment | ---- | ---- | ---2.84K | ---- | ---- | ---- | ---- | --0 | ---- | ---- |
| Other non-operating income (expenses) | 161.95%281.47K | 91.46%-48.23K | ---- | ---- | -86.32%1.13M | 39.98%-454.33K | ---564.69K | ---- | ---- | --8.24M |
| Income before tax | -276.74%-3.42M | 176.94%5.52M | -469.08%-21.58M | -759.28%-31.39M | -43.10%5.88M | -49.55%1.94M | 146.12%1.99M | 204.02%5.85M | 39.36%-3.65M | 263.66%10.34M |
| Income tax | 758.12%473.84K | 391.84K | 1.47%508.57K | 76.71%701.12K | -120.55K | -168.95%-72K | 0 | 13.43%501.18K | 22.24%396.77K | 0 |
| Earnings from equity interest net of tax | ||||||||||
| Net income | -294.00%-3.9M | 157.30%5.13M | -466.28%-24.52M | -1,178.36%-34.53M | -41.93%6M | -46.21%2.01M | 145.39%1.99M | 210.43%6.69M | 57.46%-2.7M | 294.67%10.34M |
| Net income continuous operations | -294.00%-3.9M | 157.30%5.13M | -513.20%-22.09M | -692.41%-32.09M | -41.93%6M | -46.21%2.01M | 145.39%1.99M | 188.17%5.35M | 36.21%-4.05M | 294.67%10.34M |
| Net income discontinuous operations | ---- | --0 | -280.39%-2.43M | ---- | ---- | ---- | ---- | --1.35M | ---- | ---- |
| Noncontrolling interests | 0 | 0 | 80.03%-2.13K | 51.57%-20.16K | 95.62%-1.83K | 83.43%-10.67K | ||||
| Net income attributable to the company | -292.07%-3.9M | 157.06%5.13M | -466.28%-24.52M | -1,136.20%-34.55M | -41.97%6.01M | -46.27%2.03M | 145.87%2M | 216.43%6.69M | 55.71%-2.8M | 285.60%10.35M |
| Preferred stock dividends | ||||||||||
| Other under preferred stock dividend | ||||||||||
| Net income attributable to common stockholders | -292.07%-3.9M | 157.06%5.13M | -466.28%-24.52M | -1,136.20%-34.55M | -41.97%6.01M | -46.27%2.03M | 145.87%2M | 216.43%6.69M | 55.71%-2.8M | 285.60%10.35M |
| Diluted earnings per share | -293.33%-0.29 | 178.57%0.39 | -497.18%-1.7917 | -1,304.08%-2.5117 | -36.23%0.44 | -40.00%0.15 | 341.38%0.14 | 212.78%0.4511 | 59.06%-0.1789 | 360.00%0.69 |
| Basic earnings per share | -307.14%-0.29 | 171.43%0.38 | -501.32%-1.7917 | -1,304.08%-2.5117 | -36.23%0.44 | -44.00%0.14 | 341.38%0.14 | 211.61%0.4465 | 59.06%-0.1789 | 360.00%0.69 |
| Dividend per share | 0 | 0 | 0 | 0 | 0 | 0 | 0 | 0 | 0 | 0 |
| Accounting Standards | US-GAAP | US-GAAP | US-GAAP | US-GAAP | US-GAAP | US-GAAP | US-GAAP | US-GAAP | US-GAAP | US-GAAP |
| Audit Opinions | -- | -- | Unqualified Opinion | -- | -- | -- | -- | Unqualified Opinion | -- | -- |
FY: Financial Year. Refers to the 10-K file disclosed by the listed company to the SEC.
Q: Quarter. Refers to the 10-Q file disclosed by the listed company to the SEC. Q1, Q2, Q3, and Q4 are quarterly reports each with a span of 3 months; Q6 and Q9 are cumulative reports, with Q6 including 6 months and Q9 9 months.