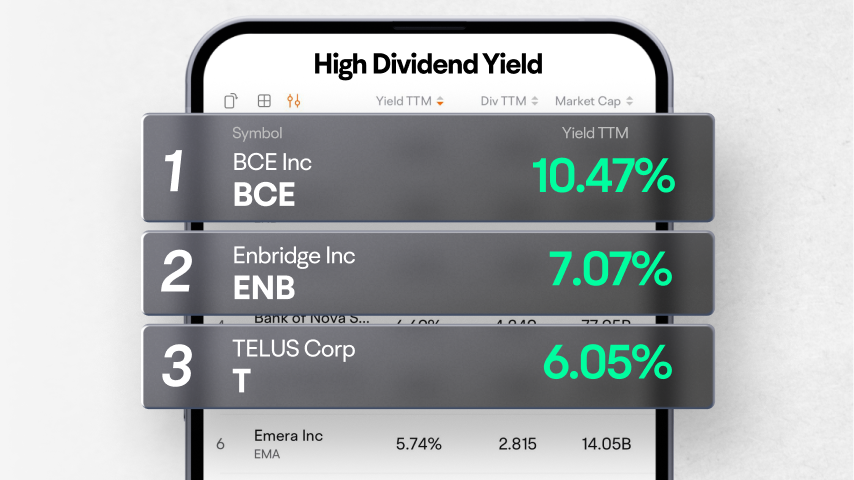
BCE Inc
BCE
The Toronto-Dominion Bank
TD
TELUS Corp
T
Brookfield Renewable Partners LP
BEP.UN
Choice Properties Real Estate Investment Trust
CHP.UN
| (Q3)Sep 30, 2024 | (Q2)Jun 30, 2024 | (Q1)Mar 31, 2024 | (FY)Dec 31, 2023 | (Q4)Dec 31, 2023 | (Q3)Sep 30, 2023 | (Q2)Jun 30, 2023 | (Q1)Mar 31, 2023 | (FY)Dec 31, 2022 | (Q4)Dec 31, 2022 | |
|---|---|---|---|---|---|---|---|---|---|---|
| Operating cash flow (direct method) | ||||||||||
| Cash income from operating activities | 65.87%74.92M | 100.98%102.59M | 49.76%69.37M | 53.50%210.44M | 58.26%67.95M | 20.16%45.17M | 84.40%51.05M | 60.15%46.32M | 14.93%137.09M | 29.60%42.93M |
| Revenue from customers | 65.82%74.88M | 84.52%94.19M | 100.67%69.3M | 45.38%198.86M | 58.79%68.12M | 20.14%45.16M | 84.82%51.05M | 20.43%34.54M | 15.87%136.78M | 31.13%42.9M |
| Other cash income from operating activities | 342.86%31K | --8.41M | -99.39%72K | 3,625.40%11.59M | -597.14%-174K | --7K | ---- | 4,672.47%11.79M | -59.97%311K | -91.57%35K |
| Cash paid | -39.45%-77.44M | -120.25%-96.39M | -56.03%-60.27M | -21.19%-219.79M | -82.12%-81.9M | -37.50%-55.53M | -7.74%-43.77M | 30.31%-38.62M | -54.70%-181.36M | -13.71%-44.97M |
| Payments to suppliers for goods and services | -39.41%-76.75M | -121.27%-95.11M | -55.15%-57.68M | -22.21%-216.45M | -82.86%-81.24M | -38.00%-55.05M | -7.27%-42.98M | -44.32%-37.18M | -51.07%-177.12M | -12.33%-44.43M |
| Other cash payments from operating activities | ---- | ---- | ---- | ---- | ---- | ---- | ---56K | ---- | ---- | ---- |
| Direct interest received | -25.34%330K | 79.74%559K | 59.58%533K | 201.37%1.54M | 29.18%456K | 649.15%442K | 547.92%311K | 542.31%334K | 51.48%512K | 263.92%353K |
| Direct tax refund paid | -44.35%-690K | -76.86%-1.28M | -78.84%-2.59M | 21.53%-3.33M | -25.37%-682K | -4.14%-478K | -32.00%-726K | 46.31%-1.45M | -1,023.04%-4.25M | -27,100.00%-544K |
| Operating cash flow | 77.90%-2.19M | -10.96%6.76M | 20.01%9.64M | 82.18%-7.8M | -700.77%-13.5M | -262.51%-9.92M | 158.88%7.59M | 130.38%8.03M | -1,932.33%-43.76M | 73.35%-1.69M |
| Investing cash flow | ||||||||||
| Cash flow from continuing investing activities | -3,268.15%-4.55M | -44.36%-999K | -105.25%-86K | 163.62%1.34M | -33.25%528K | 97.54%-135K | -37.03%-692K | -47.04%1.64M | -137.63%-2.1M | 439.48%791K |
| Net PPE purchase and sale | -38.52%-187K | -277.50%-755K | 62.22%-68K | -9.23%-663K | -15.63%-148K | -46.74%-135K | 43.50%-200K | -445.45%-180K | 30.63%-607K | 17.42%-128K |
| Net business purchase and sale | --0 | --0 | ---455K | --0 | --0 | --0 | --0 | --0 | -1,280.38%-3.59M | --0 |
| Dividends received (cash flow from investment activities) | --640K | --0 | --400K | --676K | --676K | --0 | --0 | --0 | --0 | ---- |
| Net other investing changes | ---5M | 50.41%-244K | -97.96%37K | -36.69%1.33M | --0 | ---- | -225.83%-492K | -41.84%1.82M | 737.20%2.09M | 404.95%919K |
| Cash from discontinued investing activities | ||||||||||
| Investing cash flow | -3,268.15%-4.55M | -44.36%-999K | -105.25%-86K | 163.62%1.34M | -33.25%528K | 97.54%-135K | -37.03%-692K | -47.04%1.64M | -137.63%-2.1M | 439.48%791K |
| Financing cash flow | ||||||||||
| Cash flow from continuing financing activities | -346.80%-11.85M | -217.32%-5.62M | 55.64%-7.87M | -59.91%7.41M | -17.93%15.56M | -67.62%4.8M | 106.64%4.79M | -0.66%-17.74M | -43.53%18.48M | -53.57%18.96M |
| Net issuance payments of debt | -266.59%-10.47M | -90.21%1.04M | 60.49%-6.08M | -27.78%23.44M | -10.09%21.95M | -72.16%6.28M | 325.06%10.6M | 9.54%-15.39M | 175.26%32.45M | 116.60%24.41M |
| Net common stock issuance | --0 | --0 | -73.91%-40K | ---135K | ---69K | ---43K | --0 | ---23K | --0 | --0 |
| Cash dividends paid | --0 | -11.63%-5.4M | --0 | -13.28%-9.66M | 9.87%-3.84M | --0 | ---4.83M | --0 | -35.83%-8.53M | ---4.27M |
| Interest paid (cash flow from financing activities) | 3.27%-1.39M | -30.95%-1.27M | -29.34%-1.75M | -113.87%-5.24M | -26.08%-1.49M | -196.69%-1.44M | -452.00%-966K | -121.08%-1.35M | -31.05%-2.45M | -255.72%-1.18M |
| Net other financing activities | ---- | ---- | ---- | 66.98%-986K | ---- | ---- | ---10K | ---976K | -271.86%-2.99M | ---6K |
| Cash from discontinued financing activities | ||||||||||
| Financing cash flow | -346.80%-11.85M | -217.32%-5.62M | 55.64%-7.87M | -59.91%7.41M | -17.93%15.56M | -67.62%4.8M | 106.64%4.79M | -0.66%-17.74M | -43.53%18.48M | -53.57%18.96M |
| Net cash flow | ||||||||||
| Beginning cash position | -2.11%39.37M | 37.53%39.23M | 2.59%37.55M | -42.79%36.6M | 88.61%34.96M | 237.40%40.22M | 24.04%28.53M | -42.79%36.6M | 115.09%63.98M | -37.60%18.54M |
| Current changes in cash | -253.90%-18.59M | -98.83%137K | 120.86%1.68M | 103.46%948K | -85.69%2.59M | -179.40%-5.25M | 205.53%11.69M | 80.30%-8.07M | -179.97%-27.38M | -47.30%18.06M |
| End cash Position | -40.58%20.77M | -2.11%39.37M | 37.53%39.23M | 2.59%37.55M | 2.59%37.55M | 88.61%34.96M | 237.40%40.22M | 24.04%28.53M | -42.79%36.6M | -42.79%36.6M |
| Free cash from | 76.33%-2.38M | -18.77%6M | 21.90%9.57M | 80.93%-8.46M | -652.43%-13.65M | -255.50%-10.06M | 155.79%7.39M | 129.67%7.85M | -3,032.12%-44.36M | 72.01%-1.81M |
| Accounting Standards | US-GAAP | US-GAAP | US-GAAP | US-GAAP | US-GAAP | US-GAAP | US-GAAP | US-GAAP | US-GAAP | US-GAAP |
| Audit Opinions | -- | -- | -- | Unqualified Opinion | -- | -- | -- | -- | Unqualified Opinion | -- |
FY: Financial Year. Refers to the 10-K file disclosed by the listed company to the SEC.
Q: Quarter. Refers to the 10-Q file disclosed by the listed company to the SEC. Q1, Q2, Q3, and Q4 are quarterly reports each with a span of 3 months; Q6 and Q9 are cumulative reports, with Q6 including 6 months and Q9 9 months.
