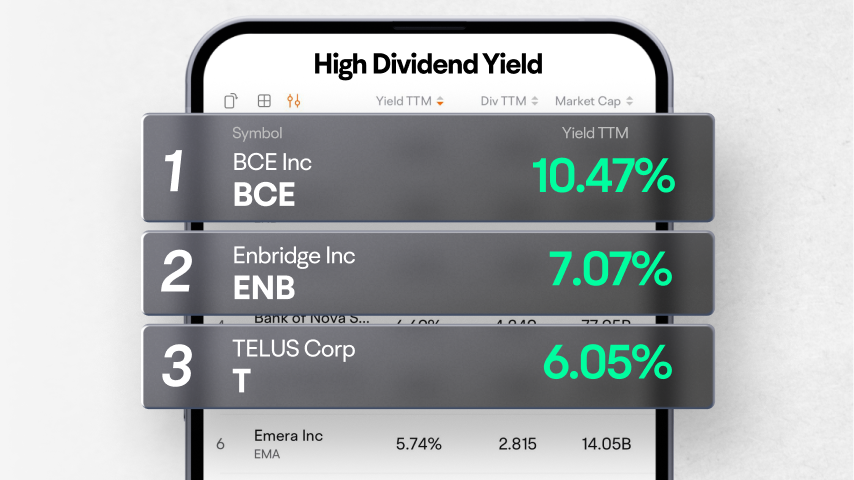
Enbridge Inc
ENB
Power Corporation of Canada
POW
Bank of Nova Scotia
BNS
4
Emera Inc
EMA
5
BCE Inc
BCE


| (Q3)Jun 30, 2024 | (Q2)Mar 31, 2024 | (Q1)Dec 31, 2023 | (FY)Sep 30, 2023 | (Q4)Sep 30, 2023 | (Q3)Jun 30, 2023 | (Q2)Mar 31, 2023 | (Q1)Dec 31, 2022 | (FY)Sep 30, 2022 | (Q4)Sep 30, 2022 | |
|---|---|---|---|---|---|---|---|---|---|---|
| Total revenue | 0 | 0 | 0 | 0 | 0 | 0 | 0 | 0 | 0 | 0 |
| Operating revenue | --0 | --0 | --0 | --0 | --0 | --0 | --0 | --0 | --0 | --0 |
| Cost of revenue | ||||||||||
| Gross profit | ||||||||||
| Operating expense | 81.33%98.38K | -52.95%111.89K | 40.24%84.75K | 3.01%408.43K | -4.01%55.94K | -25.31%54.25K | 33.76%237.8K | -31.19%60.43K | -58.65%396.51K | -31.56%58.27K |
| Selling and administrative expenses | 60.15%34.53K | -77.36%44.92K | 10.80%29.83K | -1.32%267.66K | -46.83%20.79K | -53.27%21.56K | 33.60%198.38K | -40.63%26.93K | -65.80%271.24K | 14.87%39.11K |
| -Selling and marketing expense | 1,700.72%15K | 424.11%15K | 85.77%15.83K | -76.20%13.05K | -94.37%834 | -95.42%833 | -86.93%2.86K | 9.82%8.52K | 448.31%54.83K | --14.81K |
| -General and administrative expense | -5.79%19.53K | -84.70%29.92K | -23.93%14K | 17.65%254.61K | -17.86%19.96K | -25.81%20.73K | 54.46%195.52K | -51.05%18.4K | -72.36%216.41K | -28.62%24.3K |
| Other operating expenses | 95.29%63.85K | 69.88%66.97K | 63.90%54.91K | 12.38%140.77K | 83.38%35.15K | 23.37%32.7K | 34.60%39.42K | -21.10%33.51K | -24.46%125.26K | -62.50%19.17K |
| Operating profit | -81.33%-98.38K | 52.95%-111.89K | -40.24%-84.75K | -3.01%-408.43K | 4.01%-55.94K | 25.31%-54.25K | -33.76%-237.8K | 31.19%-60.43K | 58.65%-396.51K | 31.56%-58.27K |
| Net non-operating interest income (expenses) | 64.10%-70 | -1,229.90%-2.71K | 58.87%-241 | 38.76%-1.18K | -137.67%-194 | -30.87%-195 | 74.75%-204 | 60.59%-586 | -149.94%-1.93K | 410.24%515 |
| Non-operating interest income | 23.68%47 | 120.05%823 | 19.05%25 | 436.90%451 | 800.00%18 | 660.00%38 | 663.27%374 | -22.22%21 | -18.45%84 | -85.71%2 |
| Non-operating interest expense | -49.79%117 | 511.76%3.54K | -56.18%266 | -18.90%1.63K | 141.33%212 | 51.30%233 | -32.56%578 | -59.91%607 | 130.09%2.01K | -385.00%-513 |
| Other net income (expenses) | 74.12%-23.75K | -55.34%186.25K | -12.5K | 266.67K | -58.61K | -91.78K | 417.06K | |||
| Gain on sale of security | 72.86%-23.75K | -30.00%35K | ---12.5K | ---87.5K | ---50K | ---87.5K | --50K | ---- | ---- | ---- |
| Special income (charges) | --0 | -58.79%151.25K | ---- | --354.17K | ---8.61K | ---4.28K | --367.06K | ---- | --0 | --0 |
| -Less:Impairment of capital assets | ---- | ---- | ---- | --8.68K | ---- | ---- | ---- | ---- | --0 | ---- |
| -Gain on sale of property,plant,equipment | --0 | -58.79%151.25K | ---- | --362.84K | --68 | ---4.28K | --367.06K | ---- | --0 | --0 |
| Income before tax | 16.43%-122.2K | -59.98%71.65K | -59.77%-97.49K | 64.13%-142.94K | -98.66%-114.74K | -100.90%-146.23K | 200.26%179.05K | 31.68%-61.02K | 58.48%-398.43K | 32.30%-57.76K |
| Income tax | ||||||||||
| Earnings from equity interest net of tax | ||||||||||
| Net income | 16.43%-122.2K | -59.98%71.65K | -59.77%-97.49K | 64.13%-142.94K | -98.66%-114.74K | -100.90%-146.23K | 200.26%179.05K | 31.68%-61.02K | 58.48%-398.43K | 32.30%-57.76K |
| Net income continuous operations | 16.43%-122.2K | -59.98%71.65K | -59.77%-97.49K | 64.13%-142.94K | -98.66%-114.74K | -100.90%-146.23K | 200.26%179.05K | 31.68%-61.02K | 58.48%-398.43K | 32.30%-57.76K |
| Noncontrolling interests | ||||||||||
| Net income attributable to the company | 16.43%-122.2K | -59.98%71.65K | -59.77%-97.49K | 64.13%-142.94K | -98.66%-114.74K | -100.90%-146.23K | 200.26%179.05K | 31.68%-61.02K | 58.48%-398.43K | 32.30%-57.76K |
| Preferred stock dividends | ||||||||||
| Other under preferred stock dividend | ||||||||||
| Net income attributable to common stockholders | 16.43%-122.2K | -59.98%71.65K | -59.77%-97.49K | 64.13%-142.94K | -98.66%-114.74K | -100.90%-146.23K | 200.26%179.05K | 31.68%-61.02K | 58.48%-398.43K | 32.30%-57.76K |
| Diluted earnings per share | 37.29%-0.0037 | -69.86%0.0022 | -33.33%-0.004 | 70.00%-0.006 | -71.43%-0.0048 | -63.89%-0.0059 | 182.95%0.0073 | 40.00%-0.003 | 60.00%-0.02 | -0.0028 |
| Basic earnings per share | 37.29%-0.0037 | -68.97%0.0018 | -33.33%-0.004 | 70.00%-0.006 | -71.43%-0.0048 | -63.89%-0.0059 | 165.91%0.0058 | 40.00%-0.003 | 60.00%-0.02 | -0.0028 |
| Dividend per share | ||||||||||
| Accounting Standards | US-GAAP | US-GAAP | US-GAAP | US-GAAP | US-GAAP | US-GAAP | US-GAAP | US-GAAP | US-GAAP | US-GAAP |
| Audit Opinions | -- | -- | -- | Unqualified Opinion with Explanatory Notes | -- | -- | -- | -- | Unqualified Opinion with Explanatory Notes | -- |
FY: Financial Year. Refers to the 10-K file disclosed by the listed company to the SEC.
Q: Quarter. Refers to the 10-Q file disclosed by the listed company to the SEC. Q1, Q2, Q3, and Q4 are quarterly reports each with a span of 3 months; Q6 and Q9 are cumulative reports, with Q6 including 6 months and Q9 9 months.