Brookfield Renewable Partners LP
BEP.UN
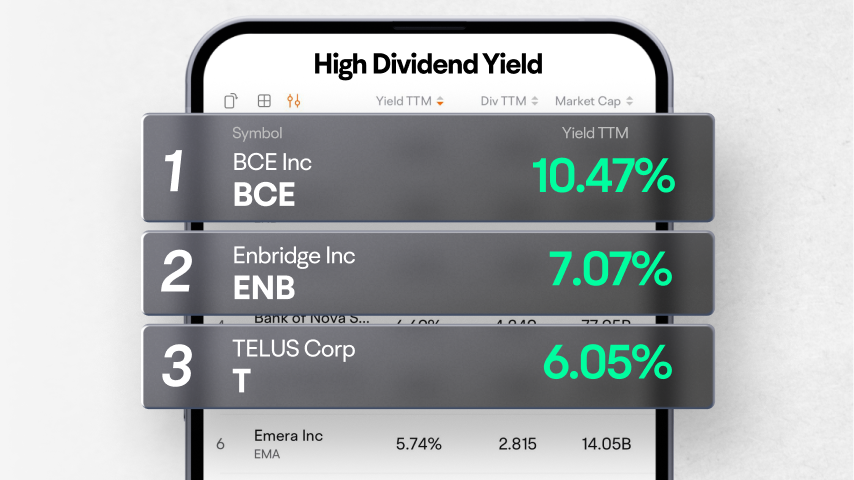
Emera Inc
EMA
Power Corporation of Canada
POW
TELUS Corp
T
Choice Properties Real Estate Investment Trust
CHP.UN


| (Q3)Sep 30, 2024 | (Q2)Jun 30, 2024 | (Q1)Mar 31, 2024 | (FY)Dec 31, 2023 | (Q4)Dec 31, 2023 | (Q3)Sep 30, 2023 | (Q2)Jun 30, 2023 | (Q1)Mar 31, 2023 | (FY)Dec 31, 2022 | (Q4)Dec 31, 2022 | |
|---|---|---|---|---|---|---|---|---|---|---|
| Total revenue | 241.11%4.99M | 125.40%3.55M | -14.67%1.68M | -8.80%6.2M | 1.53%1.2M | 27.46%1.46M | -35.42%1.58M | -3.30%1.96M | 17.18%6.8M | -50.42%1.18M |
| Operating revenue | 241.11%4.99M | 125.40%3.55M | -14.67%1.68M | -8.80%6.2M | 1.53%1.2M | 27.46%1.46M | -35.42%1.58M | -3.30%1.96M | 17.18%6.8M | -50.42%1.18M |
| Cost of revenue | 69.59%3.19M | 17.39%2.48M | -11.01%2.01M | -17.84%7.74M | -27.87%1.48M | -23.19%1.88M | -11.20%2.11M | -10.74%2.26M | 10.30%9.41M | -15.77%2.06M |
| Gross profit | 528.88%1.8M | 300.56%1.07M | -13.09%-337K | 41.28%-1.54M | 67.39%-286K | 67.82%-419K | -949.21%-535K | 40.76%-298K | 4.28%-2.62M | -1,292.06%-877K |
| Operating expense | 39.65%641K | -5.10%447K | 5.66%504K | -30.20%1.81M | -24.19%398K | -24.63%459K | -36.69%471K | -32.63%477K | 88.48%2.59M | -25.95%525K |
| Depreciation amortization depletion | 4.18%299K | -26.03%216K | -13.96%265K | -33.58%1.18M | -13.61%292K | -30.34%287K | -43.41%292K | -39.49%308K | 0.74%1.78M | -28.24%338K |
| -Depreciation and amortization | 4.18%299K | -26.03%216K | -13.96%265K | -33.58%1.18M | -13.61%292K | -30.34%287K | -43.41%292K | -39.49%308K | 0.74%1.78M | -28.24%338K |
| Other operating expenses | 98.84%342K | 29.05%231K | 41.42%239K | -22.81%626K | -84.41%106K | 364.86%172K | -21.49%179K | 428.13%169K | 177.31%811K | 1,033.33%680K |
| Operating profit | 231.66%1.16M | 162.23%626K | -8.52%-841K | 35.77%-3.34M | 51.21%-684K | 54.06%-878K | -47.72%-1.01M | 36.00%-775K | -26.70%-5.21M | -81.61%-1.4M |
| Net non-operating interest income (expenses) | -80.00%-27K | -25.00%-15K | -50.00%-18K | -11.76%-57K | -20.00%-18K | -36.36%-15K | 0.00%-12K | 7.69%-12K | 12.07%-51K | -50.00%-15K |
| Non-operating interest income | --0 | --0 | --0 | -33.33%4K | --0 | --0 | --1K | 200.00%3K | 100.00%6K | -33.33%2K |
| Non-operating interest expense | 80.00%27K | 15.38%15K | 20.00%18K | 7.02%61K | 5.88%18K | 7.14%15K | 8.33%13K | 7.14%15K | -6.56%57K | 30.77%17K |
| Other net income (expenses) | -220.00%-48K | 102.56%1K | 183.33%20K | -687.10%-244K | -95.58%-221K | -51.81%40K | -250.00%-39K | 11.11%-24K | -103.74%-31K | -110.52%-113K |
| Gain on sale of security | -211.63%-48K | 102.56%1K | 183.33%20K | -677.42%-241K | -95.58%-221K | -48.19%43K | -250.00%-39K | 11.11%-24K | -102.92%-31K | -110.52%-113K |
| Special income (charges) | --0 | ---- | ---- | ---3K | --0 | ---3K | ---- | ---- | --0 | --0 |
| -Gain on sale of property,plant,equipment | --0 | ---- | ---- | ---3K | --0 | ---3K | ---- | ---- | --0 | --0 |
| Income before tax | 226.73%1.08M | 157.90%612K | -3.45%-839K | 31.08%-3.64M | 39.67%-923K | 53.62%-853K | -58.47%-1.06M | 35.17%-811K | -58.39%-5.29M | -623.97%-1.53M |
| Income tax | 0 | 0 | 0 | 1,525.00%57K | 454.55%61K | 0 | 73.33%-4K | 0 | -122.22%-4K | 11K |
| Earnings from equity interest net of tax | ||||||||||
| Net income | 226.73%1.08M | 158.12%612K | -3.45%-839K | 29.95%-3.7M | 36.15%-984K | 53.62%-853K | -61.50%-1.05M | 35.17%-811K | -57.42%-5.28M | -627.74%-1.54M |
| Net income continuous operations | 226.73%1.08M | 158.12%612K | -3.45%-839K | 29.95%-3.7M | 36.15%-984K | 53.62%-853K | -61.50%-1.05M | 35.17%-811K | -57.42%-5.28M | -627.74%-1.54M |
| Noncontrolling interests | ||||||||||
| Net income attributable to the company | 226.73%1.08M | 158.12%612K | -3.45%-839K | 29.95%-3.7M | 36.15%-984K | 53.62%-853K | -61.50%-1.05M | 35.17%-811K | -57.42%-5.28M | -627.74%-1.54M |
| Preferred stock dividends | ||||||||||
| Other under preferred stock dividend | ||||||||||
| Net income attributable to common stockholders | 226.73%1.08M | 158.12%612K | -3.45%-839K | 29.95%-3.7M | 36.15%-984K | 53.62%-853K | -61.50%-1.05M | 35.17%-811K | -57.42%-5.28M | -627.74%-1.54M |
| Diluted earnings per share | 200.00%0.02 | 133.33%0.01 | 0.00%-0.02 | 37.50%-0.1 | 40.00%-0.03 | 66.67%-0.02 | -50.00%-0.03 | 50.00%-0.02 | -33.33%-0.16 | -350.00%-0.05 |
| Basic earnings per share | 200.00%0.02 | 133.33%0.01 | 0.00%-0.02 | 37.50%-0.1 | 40.00%-0.03 | 66.67%-0.02 | -50.00%-0.03 | 50.00%-0.02 | -33.33%-0.16 | -350.00%-0.05 |
| Dividend per share | ||||||||||
| Accounting Standards | US-GAAP | US-GAAP | US-GAAP | US-GAAP | US-GAAP | US-GAAP | US-GAAP | US-GAAP | US-GAAP | US-GAAP |
| Audit Opinions | -- | -- | -- | Unqualified Opinion with Explanatory Notes | -- | -- | -- | -- | Unqualified Opinion with Explanatory Notes | -- |
FY: Financial Year. Refers to the 10-K file disclosed by the listed company to the SEC.
Q: Quarter. Refers to the 10-Q file disclosed by the listed company to the SEC. Q1, Q2, Q3, and Q4 are quarterly reports each with a span of 3 months; Q6 and Q9 are cumulative reports, with Q6 including 6 months and Q9 9 months.